The learning study
What did the study show?
Open this after trying the tutorial. These are calculated results from the fixed synthetic dataset, not illustrative numbers or evidence about actual learning strategies. This is one worked approach, not a prescribed answer to the tutorial prompts. Your agent may suggest different methodological choices; compare those choices before expecting identical numbers.
The data and the comparison
There are 80 unique participants, 40 in each condition, with no missing values. Every score is an integer within the permitted 0–100 range. The observed range is 42–87 in each group. All rows were retained for the comparison and figure.
| Condition | n | Missing | M | SD | Median | Q1–Q3 |
|---|---|---|---|---|---|---|
| Active practice | 40 | 0 | 67.47 | 10.19 | 68.50 | 60.00–73.25 |
| Rereading | 40 | 0 | 61.83 | 11.30 | 60.50 | 52.00–71.00 |
Means follow NLSS's display rounding; exact means are 67.475 and 61.825. Use the unrounded values to calculate the difference. Different decimal-tie rounding can display the first mean as 67.48; this is not a different analysis.
Why this comparison?
The reference asks about the difference between the groups' mean test scores. Each learner contributes one score. It uses a two-sided Welch comparison, which does not require equal population variances. This is the approach used for the saved reference, rather than a method specified in the study sheet.
| Quantity | Reference |
|---|---|
| Mean difference, practice − rereading | 5.65 score points |
| 95% CI for that mean difference | [0.86, 10.44] |
| Welch t | 2.35 |
| Welch degrees of freedom | 77.19 |
| Two-sided p | .021 |
| Cohen's d, pooled sample SD | 0.53 |
The analysis used unequal-variance Welch inference, a two-sided alternative, 95% confidence and no bootstrap. The saved request explicitly orders practice before rereading. The interval is for a population mean difference under the statistical model, not for individual learners or for d.
A distribution view
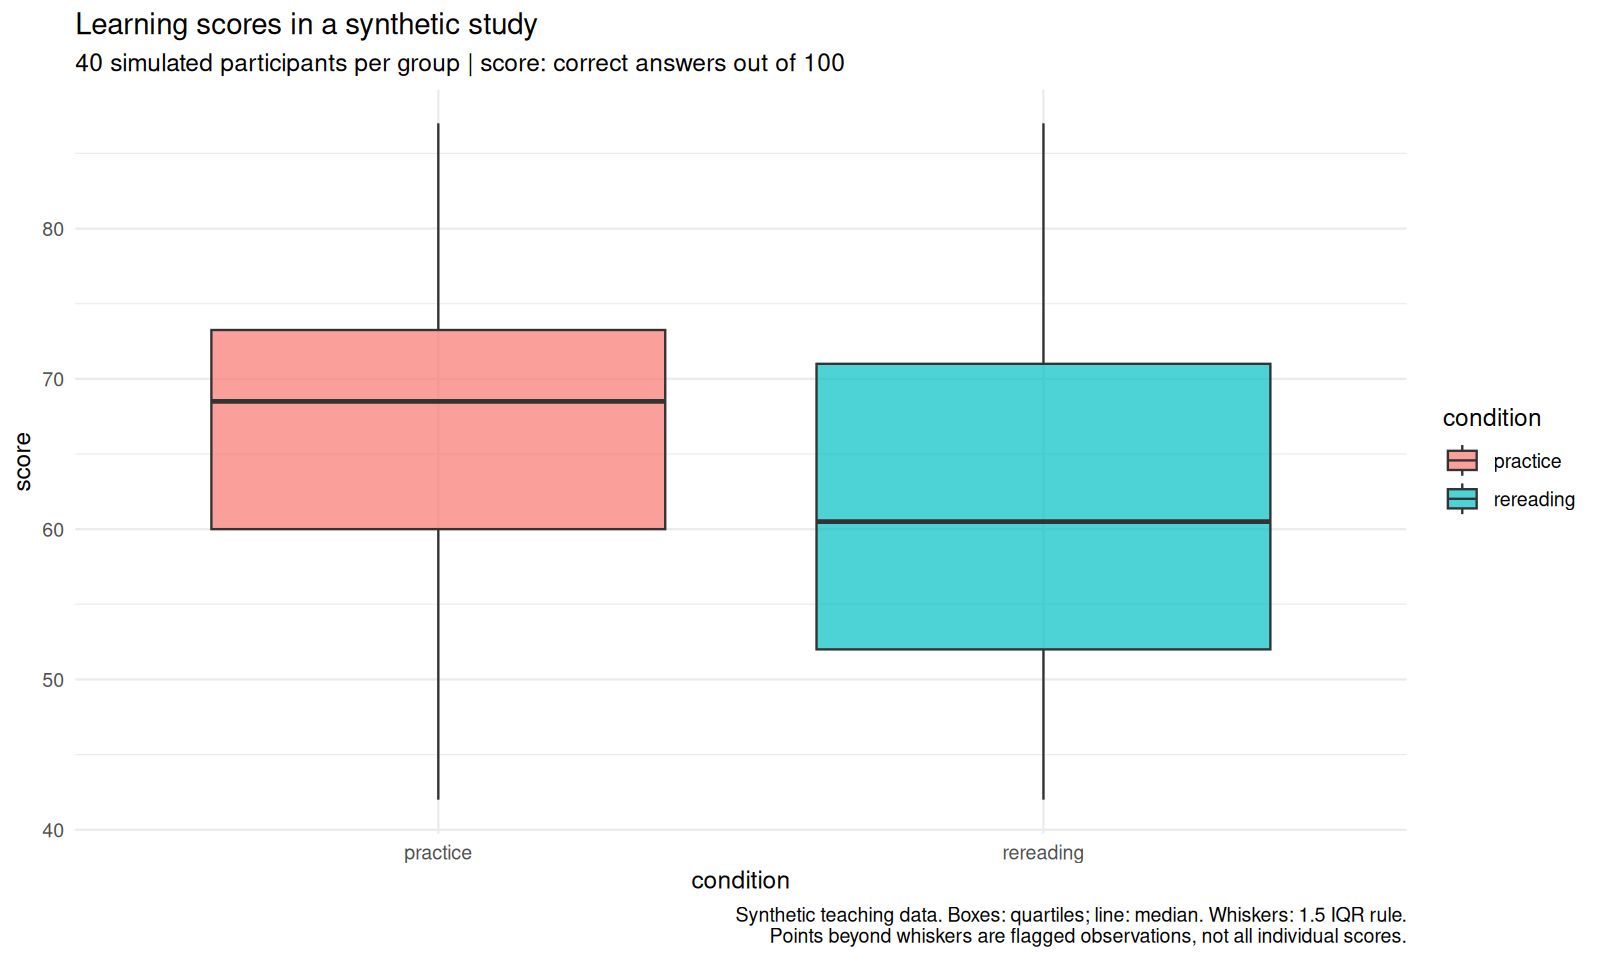
Figure 1. Actual NLSS output for all 80 cases. Boxes show the first and third quartiles, with a line at the median. Whiskers extend to the most extreme observations within 1.5 interquartile ranges of the box. No observations fall beyond those whiskers here. The y-axis covers the observed region rather than the full possible 0–100 scale. The plot summarizes distributions; it shows neither every individual score nor confidence intervals for means. Its marked overlap does not contradict a nonzero mean difference.
The saved plot result retains all plotted scores, source rows, category mappings and numerical boxplot layers. It allows checking the figure against the CSV.
How to reason about this result
- Direction and size: the practice group scored 5.65 points higher on average in this generated sample. This is not the generator's 0.28 logit coefficient, nor a 5.65% relative increase. On this 100-item score it is 5.65 percentage points of correct answers.
- Uncertainty: under the model, the 95% interval runs from a small positive difference to about ten points. In repeated sampling, the interval procedure is designed for approximately 95% coverage; it does not give a 95% probability that this fixed parameter is inside the realized interval.
- The p-value: under a zero mean difference and the test assumptions, results at least as extreme in either direction would have probability about .021. This is not the probability that the null is true or that the result was "caused by chance."
- Diagnostics: Shapiro–Wilk p = .890 and .501; median-centred Levene p = .456. These screens do not demonstrate normality, equal variances or independence. No diagnostic result changed the preselected Welch analysis.
- Research meaning: educational importance needs a substantive threshold, cost and setting. Random assignment is not representative sampling, and simulated assignment is not empirical validation. No real-world efficacy claim follows from these numbers.
Inspect or reproduce
- Example result section: editable, freely authored prose.
- Automatic protocol: original NLSS tables and output.
- Welch request and result: options and numbers.
- Unrounded numerical reference and 90 checks: all passed.
- Generator and independent check: readable R source.
- Reproduction instructions: use a copy of the complete project.
The independent check recalculates the analysis from CSV using explicit Welch formulas and stats::t.test; it does not feed NLSS outputs into the reference calculation. Both still use base R's distribution functions. This is an independent calculation path, not validation in a second statistical engine.
Material 1.0 · NLSS 2.0.1 · R 4.5.2 · © 2026 Mike Hammes / NLSS, CC BY 4.0.