The learning study
Inside the analysis protocol.
Original NLSS 2.0.1 output. Its figure heading and image alternative text have a known numbering inconsistency. The plotted data and calculations are unaffected. Read the interpreted reference.
Analysis protocol
data_explorer — completed
Run: 20260918T081408-3260430d8 Dataset: ds-DZaFnUNXx4cvUCyzfmwVu5jJmwRlQuRb; version: v-e2ac56d36e349054b871523803d9b0db81dc7be861808d6c2518c76521c17b05 Request · Result · Run output
Data Exploration
Analysis
- Variables: id, condition, score
- Max levels: 20
- Top levels: 10
- Rounding digits: 2
Table 1
Variable Overview
| Variable | Class | Scale | n | Missing % | Unique | M | SD | Min | Max |
|---|---|---|---|---|---|---|---|---|---|
| id | integer | interval/ratio | 80 | 0.00 | 80 | 40.50 | 23.24 | 1.00 | 80.00 |
| condition | character | nominal | 80 | 0.00 | 2 | ||||
| score | integer | interval/ratio | 80 | 0.00 | 38 | 64.65 | 11.06 | 42.00 | 87.00 |
Note. Scale levels are heuristic; interval/ratio cannot be distinguished automatically.
Table 2
Value Levels
| Variable | Level | n | % | Valid % |
|---|---|---|---|---|
| condition | practice | 40 | 50.00 | 50.00 |
| condition | rereading | 40 | 50.00 | 50.00 |
Note. % = percent of total. Valid % excludes missing values. Missing values are listed separately.
Narrative
id (integer, scale: interval/ratio): n = 80, missing = 0 (0.00%), unique values = 80. M = 40.50, SD = 23.24, Min = 1.00, Max = 80.00.
condition (character, scale: nominal): n = 80, missing = 0 (0.00%), unique values = 2. Levels: practice (n = 40, valid % = 50.00); rereading (n = 40, valid % = 50.00).
score (integer, scale: interval/ratio): n = 80, missing = 0 (0.00%), unique values = 38. M = 64.65, SD = 11.06, Min = 42.00, Max = 87.00.
descriptive_stats — completed
Run: 20260918T081414-bf45cc1f66 Dataset: ds-DZaFnUNXx4cvUCyzfmwVu5jJmwRlQuRb; version: v-e2ac56d36e349054b871523803d9b0db81dc7be861808d6c2518c76521c17b05 Request · Result · Run output
Descriptive Statistics
Analysis
- Variables: score
- Grouping variable: condition
- Rounding digits: 2
- Trim proportion: 0.1
- IQR multiplier: 1.5
- Outlier z threshold: 3
Table 3
Descriptive Statistics
| Variable | Group | n | M | SD | Min | Max |
|---|---|---|---|---|---|---|
| score | practice | 40 | 67.47 | 10.19 | 42.00 | 87.00 |
| score | rereading | 40 | 61.83 | 11.30 | 42.00 | 87.00 |
Note. M = mean; SD = standard deviation. Missing values excluded per variable.
Narrative
Group practice, score: M = 67.47, SD = 10.19, 95% CI [64.22, 70.73], n = 40, missing = 0 (0.0%).
Group rereading, score: M = 61.83, SD = 11.30, 95% CI [58.21, 65.44], n = 40, missing = 0 (0.0%).
assumptions — completed
Run: 20260918T081421-18379fd17a0 Dataset: ds-DZaFnUNXx4cvUCyzfmwVu5jJmwRlQuRb; version: v-e2ac56d36e349054b871523803d9b0db81dc7be861808d6c2518c76521c17b05 Request · Result · Run output
Assumption Checks (t Tests)
Analysis
- Analysis: ttest
- Mode: independent
- Variables: score
- Grouping variable: condition
- Alpha: 0.05
- Rounding digits: 2
- Normality test: shapiro
- Homogeneity Tests: levene
- Vif Warn: 5
- Vif High: 10
- Outlier Z: 3
- Cook Multiplier: 4
- Max Shapiro N: 5000
Table 4
Assumption Checks for t Tests
| Assumption | Test | Variable | Group | n | Statistic | df | p | Status | Screen |
|---|---|---|---|---|---|---|---|---|---|
| Normality | Shapiro-Wilk | score | practice | 40 | .99 | = .890 | available | ok | |
| Normality | Shapiro-Wilk | score | rereading | 40 | .97 | = .501 | available | ok | |
| Homogeneity | Levene (median) | score | 80 | .56 | 1.00, 78.00 | = .456 | available | ok |
Note. Normality assessed with Shapiro-Wilk (alpha = 0.05). Homogeneity tests requested/configured: Levene (median). Available homogeneity rows: 1; unavailable/skipped homogeneity rows: 0. Without independent groups these checks do not apply. Availability is explicit. Diagnostic flags are screens, not a blanket analysis approval or rejection.
Narrative
Independent: Normality (Shapiro-Wilk) for score (practice), statistic = .99, p = .890, n = 40. Status: available.
Independent: Normality (Shapiro-Wilk) for score (rereading), statistic = .97, p = .501, n = 40. Status: available.
Independent: Homogeneity (Levene (median)) for score, df = 1.00, 78.00, statistic = .56, p = .456, n = 80. Status: available.
t_test — completed
Run: 20260918T081427-247130f26b3 Dataset: ds-DZaFnUNXx4cvUCyzfmwVu5jJmwRlQuRb; version: v-e2ac56d36e349054b871523803d9b0db81dc7be861808d6c2518c76521c17b05 Request · Result · Run output
t Tests
Analysis
- Variables: score
- Grouping variable: condition
- Alternative hypothesis: two.sided
- Equal variances: No
- Confidence level: 0.95
- Bootstrap: No
- Rounding digits: 2
Table 5
t Test Results
| Test | Variable | Group 1 | Group 2 | n1 | n2 | M1 | M2 | SD1 | SD2 | Mean diff | t | df | p | d | CI low | CI high |
|---|---|---|---|---|---|---|---|---|---|---|---|---|---|---|---|---|
| Independent | score | practice | rereading | 40 | 40 | 67.47 | 61.83 | 10.19 | 11.30 | 5.65 | 2.35 | 77.19 | = .021 | .53 | .86 | 10.44 |
Note. Two-tailed tests. 95% confidence intervals. Welch correction used. Analytic and bootstrap mean-difference intervals describe the first measure/group minus the second; null difference is zero. d uses the pooled sample SD, including for Welch tests.
Narrative
score: independent-samples t-test (Welch correction; practice: M = 67.47, SD = 10.19, n = 40; rereading: M = 61.83, SD = 11.30, n = 40), t(77.19) = 2.35, p = .021, d = .53, 95% CI [.86, 10.44].
plot — completed
Run: 20260918T081434-30bad27d05 Dataset: ds-DZaFnUNXx4cvUCyzfmwVu5jJmwRlQuRb; version: v-e2ac56d36e349054b871523803d9b0db81dc7be861808d6c2518c76521c17b05 Request · Result · Run output
Plots
Analysis
- Engine: ggplot2
- Variables: score
- Grouping variable: condition
- Na Action: omit
- Theme: minimal
- Palette: default
- Width: 10
- Height: 6
- Dpi: 160
- Plot Type: box
- Output Format: png
- Opacity: 0.7
Figures
Figure 1
Synthetic teaching data. Boxes: quartiles; line: median. Whiskers: 1.5 IQR rule. Points beyond whiskers are flagged observations, not all individual scores.
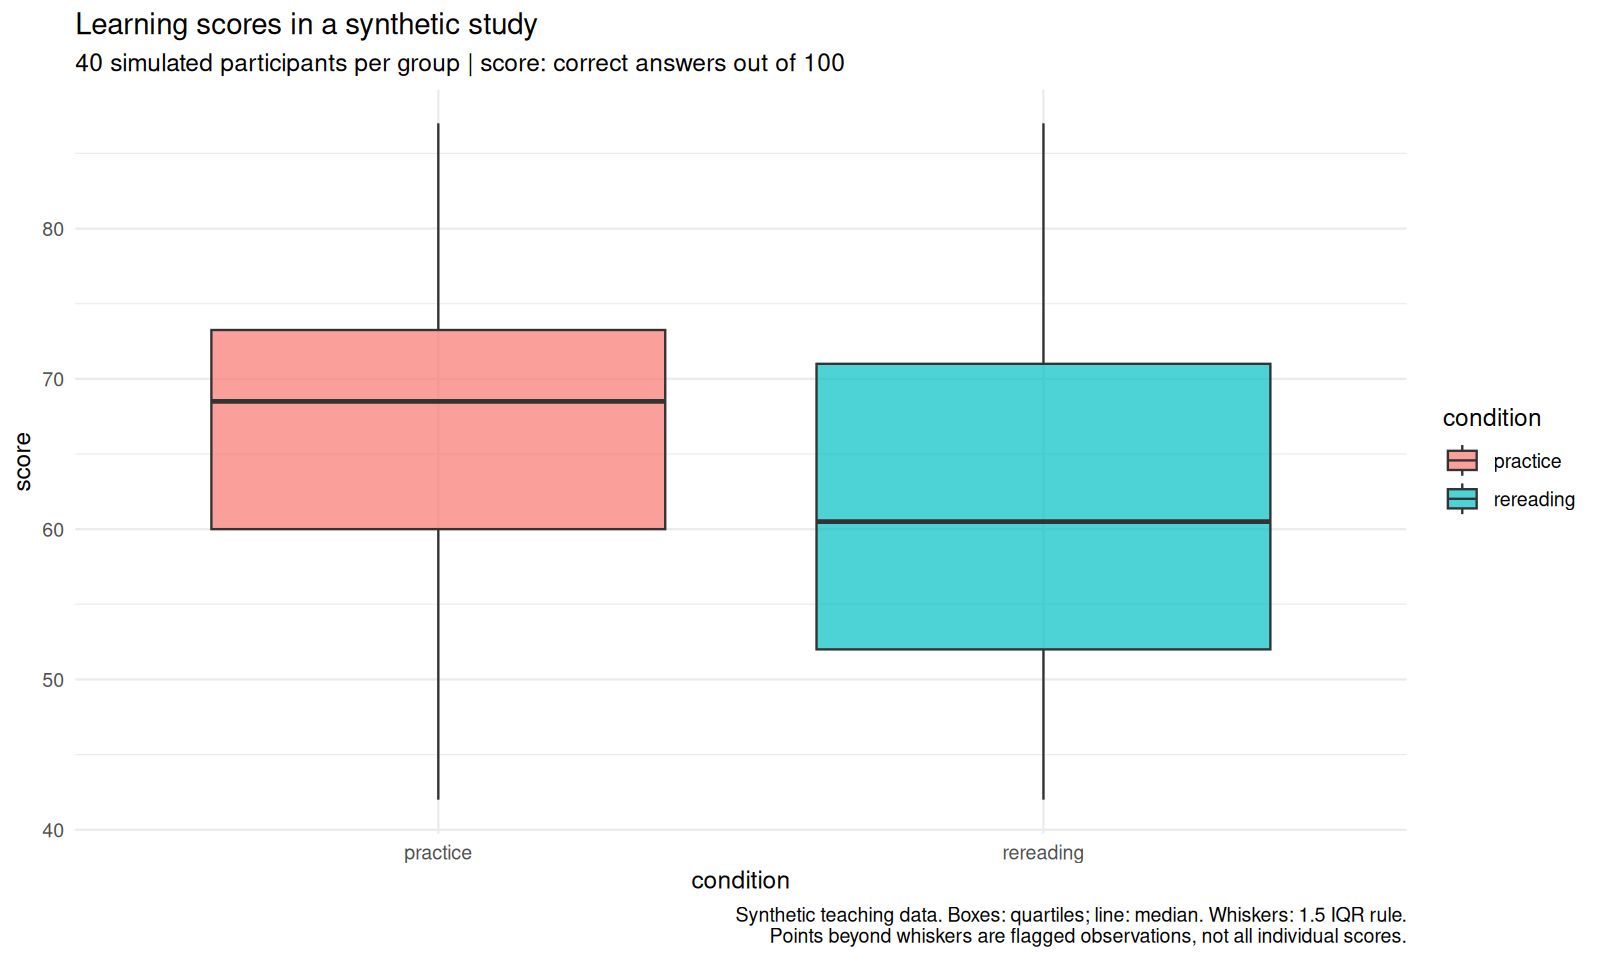
Note. Grouped by condition.