Saved evidence · NLSS 2.0.1
Analysis protocol
The saved calculation record complements the authored report. It records the numerical work; it does not establish that a method or interpretation is appropriate. Original NLSS figure numbering is preserved.
Analysis protocol
data_explorer — completed
Run: 20260918T102359-29d6ddbab3f Dataset: ds-MyubUL7nKZZivTGQpA0scBSdk8qNwpjj; version: v-93f191bb89c48fc772989008a6c894a71f23483ebc6142428fb1f88419b4822e Request · Result · Run output
Data Exploration
Analysis
- Variables: id, age, workload, resources, exhaustion
- Max levels: 20
- Top levels: 10
- Rounding digits: 2
Table 1
Variable Overview
| Variable | Class | Scale | n | Missing % | Unique | M | SD | Min | Max |
|---|---|---|---|---|---|---|---|---|---|
| id | integer | interval/ratio | 180 | 0.00 | 180 | 90.50 | 52.11 | 1.00 | 180.00 |
| age | integer | interval/ratio | 180 | 0.00 | 45 | 41.62 | 13.19 | 20.00 | 65.00 |
| workload | numeric | interval/ratio | 180 | 0.00 | 180 | 50.36 | 10.95 | 23.46 | 78.87 |
| resources | numeric | interval/ratio | 180 | 0.00 | 180 | 48.79 | 8.41 | 21.20 | 76.04 |
| exhaustion | numeric | interval/ratio | 180 | 0.00 | 179 | 50.83 | 9.91 | 21.13 | 73.91 |
Note. Scale levels are heuristic; interval/ratio cannot be distinguished automatically.
Table 2
Value Levels
(No level tables produced; see variable overview for unique counts.)
Note. None.
Narrative
id (integer, scale: interval/ratio): n = 180, missing = 0 (0.00%), unique values = 180. M = 90.50, SD = 52.11, Min = 1.00, Max = 180.00.
age (integer, scale: interval/ratio): n = 180, missing = 0 (0.00%), unique values = 45. M = 41.62, SD = 13.19, Min = 20.00, Max = 65.00.
workload (numeric, scale: interval/ratio): n = 180, missing = 0 (0.00%), unique values = 180. M = 50.36, SD = 10.95, Min = 23.46, Max = 78.87.
resources (numeric, scale: interval/ratio): n = 180, missing = 0 (0.00%), unique values = 180. M = 48.79, SD = 8.41, Min = 21.20, Max = 76.04.
exhaustion (numeric, scale: interval/ratio): n = 180, missing = 0 (0.00%), unique values = 179. M = 50.83, SD = 9.91, Min = 21.13, Max = 73.91.
regression — completed
Run: 20260918T102606-199782660a9 Dataset: ds-MyubUL7nKZZivTGQpA0scBSdk8qNwpjj; version: v-93f191bb89c48fc772989008a6c894a71f23483ebc6142428fb1f88419b4822e Request · Result · Run output
Regression
Analysis
- Dependent variable: exhaustion
- Blocks: Block 1: age; Block 2: workload, resources
- Family: gaussian
- Link: identity
- Confidence level: 0.95
- Bootstrap: No
- Rounding digits: 2
Table 3
Regression Coefficients
| Model | Predictor | b | SE | t | p | CI low | CI high |
|---|---|---|---|---|---|---|---|
| Model 1 | (Intercept) | 44.46 | 2.41 | 18.47 | < .001 | 39.71 | 49.20 |
| Model 1 | age | .15 | .06 | 2.78 | = .006 | .04 | .26 |
| Model 2 | (Intercept) | 45.16 | 5.39 | 8.37 | < .001 | 34.51 | 55.80 |
| Model 2 | age | .11 | .05 | 2.40 | = .018 | .02 | .20 |
| Model 2 | workload | .36 | .06 | 6.25 | < .001 | .25 | .47 |
| Model 2 | resources | -.35 | .07 | -4.70 | < .001 | -.50 | -.20 |
Note. Coefficients are unstandardized (b) with standard errors. CI uses 95% confidence.
Narrative
Model 1: F(1.00, 178.00) = 7.71, p = .006, R² = .04, adj. R² = .04, f² = .04.
Model 2: F(3.00, 176.00) = 29.92, p < .001, R² = .34, adj. R² = .33, f² = .51. Delta R² = .30, Delta f² = .45, F-change(2.00, 176.00) = 39.36, p < .001.
Regression: ANOVA
Analysis
- Dependent variable: exhaustion
- Blocks: Block 1: age; Block 2: workload, resources
- Family: gaussian
- Link: identity
- Confidence level: 0.95
- Bootstrap: No
- Rounding digits: 2
Table 4
Model Tests
| Model | Source | SS | df | MS | F | p |
|---|---|---|---|---|---|---|
| Model 1 | Regression | 730.57 | 1.00 | 730.57 | 7.71 | = .006 |
| Model 1 | Residual | 16861.91 | 178.00 | 94.73 | ||
| Model 1 | Total | 17592.48 | 179.00 | |||
| Model 2 | Regression | 5941.87 | 3.00 | 1980.62 | 29.92 | < .001 |
| Model 2 | Residual | 11650.60 | 176.00 | 66.20 | ||
| Model 2 | Total | 17592.48 | 179.00 |
Note. ANOVA table uses regression, residual, and total sums of squares.
assumptions — completed
Run: 20260918T102612-25f365e6489 Dataset: ds-MyubUL7nKZZivTGQpA0scBSdk8qNwpjj; version: v-93f191bb89c48fc772989008a6c894a71f23483ebc6142428fb1f88419b4822e Request · Result · Run output
Assumption Checks (Regression)
Analysis
- Analysis: regression
- Dependent variable: exhaustion
- Blocks: age;workload,resources
- Alpha: 0.05
- Rounding digits: 2
- Normality test: shapiro
- Vif Warn: 5
- Vif High: 10
- Outlier Z: 3
- Cook Multiplier: 4
- Max Shapiro N: 5000
- Linearity: Yes
- Homoscedasticity: Yes
- VIF: Yes
- Durbin Watson: No
- Outliers: Yes
- Influence: Yes
Table 5
Regression Assumption Checks
| Model | Assumption | Test | Target | Statistic | df | p | Value | Status | Screen | n |
|---|---|---|---|---|---|---|---|---|---|---|
| Block 1 | Normality | Shapiro-Wilk | Residuals | .99 | = .324 | available | ok | 180 | ||
| Block 1 | Linearity | Quadratic added-term F | age | .01 | 1.00, 177.00 | = .937 | available | ok | 180 | |
| Block 1 | Homoscedasticity | Breusch-Pagan | Residuals | .13 | 1.00 | = .721 | available | ok | 180 | |
| Block 1 | Outliers | Std. residuals | Residuals | 2.84 | available | ok | 180 | |||
| Block 1 | Influence | Cook's distance | Residuals | .05 | available | flag | 180 | |||
| Block 1 | Multicollinearity | VIF | age | 1.00 | available | ok | 180 | |||
| Block 2 | Normality | Shapiro-Wilk | Residuals | .99 | = .169 | available | ok | 180 | ||
| Block 2 | Linearity | Quadratic added-term F | age | .04 | 1.00, 175.00 | = .834 | available | ok | 180 | |
| Block 2 | Linearity | Quadratic added-term F | workload | .13 | 1.00, 175.00 | = .717 | available | ok | 180 | |
| Block 2 | Linearity | Quadratic added-term F | resources | .06 | 1.00, 175.00 | = .811 | available | ok | 180 | |
| Block 2 | Homoscedasticity | Breusch-Pagan | Residuals | .19 | 3.00 | = .980 | available | ok | 180 | |
| Block 2 | Outliers | Std. residuals | Residuals | 2.92 | available | ok | 180 | |||
| Block 2 | Influence | Cook's distance | Residuals | .04 | available | flag | 180 | |||
| Block 2 | Multicollinearity | VIF | age | 1.01 | available | ok | 180 | |||
| Block 2 | Multicollinearity | VIF | workload | 1.07 | available | ok | 180 | |||
| Block 2 | Multicollinearity | VIF | resources | 1.06 | available | ok | 180 |
Note. Normality assessed with Shapiro-Wilk (alpha = 0.05). Homoscedasticity assessed with Breusch-Pagan. VIF thresholds: 5 (moderate), 10 (high). Outliers flagged at |std resid| > 3. Cook's D threshold = 4/n. Availability is explicit. Diagnostic flags are screens, not a blanket analysis approval or rejection. Linearity uses separate centered quadratic added-term F tests. Hierarchical blocks use common complete cases. VIF is per design column, not term GVIF.
Narrative
Block 1: Normality (Shapiro-Wilk) for Residuals, statistic = .99, p = .324, n = 180. Status: available.
Block 1: Linearity (Quadratic added-term F) for age, df = 1.00, 177.00, statistic = .01, p = .937, n = 180. Status: available. One centered quadratic term added to the fitted block; a limited curvature screen, not proof of linearity.
Block 1: Homoscedasticity (Breusch-Pagan) for Residuals, df = 1.00, statistic = .13, p = .721, n = 180. Status: available. Koenker studentized n R²; auxiliary degrees of freedom use model-matrix rank minus the intercept.
Block 1: Outliers (Std. residuals) for Residuals, value = 2.84, n = 180. Status: available. |std resid| > 3: 0
Block 1: Influence (Cook's distance) for Residuals, value = .05, n = 180. Status: available. Cook's D > 0.0222222222222222: 8
Block 1: Multicollinearity (VIF) for age, value = 1.00, n = 180. Status: available. Design-column VIF; factor dummy columns are not term-level GVIF.
Block 2: Normality (Shapiro-Wilk) for Residuals, statistic = .99, p = .169, n = 180. Status: available.
Block 2: Linearity (Quadratic added-term F) for age, df = 1.00, 175.00, statistic = .04, p = .834, n = 180. Status: available. One centered quadratic term added to the fitted block; a limited curvature screen, not proof of linearity.
Block 2: Linearity (Quadratic added-term F) for workload, df = 1.00, 175.00, statistic = .13, p = .717, n = 180. Status: available. One centered quadratic term added to the fitted block; a limited curvature screen, not proof of linearity.
Block 2: Linearity (Quadratic added-term F) for resources, df = 1.00, 175.00, statistic = .06, p = .811, n = 180. Status: available. One centered quadratic term added to the fitted block; a limited curvature screen, not proof of linearity.
Block 2: Homoscedasticity (Breusch-Pagan) for Residuals, df = 3.00, statistic = .19, p = .980, n = 180. Status: available. Koenker studentized n R²; auxiliary degrees of freedom use model-matrix rank minus the intercept.
Block 2: Outliers (Std. residuals) for Residuals, value = 2.92, n = 180. Status: available. |std resid| > 3: 0
Block 2: Influence (Cook's distance) for Residuals, value = .04, n = 180. Status: available. Cook's D > 0.0222222222222222: 11
Block 2: Multicollinearity (VIF) for age, value = 1.01, n = 180. Status: available. Design-column VIF; factor dummy columns are not term-level GVIF.
Block 2: Multicollinearity (VIF) for workload, value = 1.07, n = 180. Status: available. Design-column VIF; factor dummy columns are not term-level GVIF.
Block 2: Multicollinearity (VIF) for resources, value = 1.06, n = 180. Status: available. Design-column VIF; factor dummy columns are not term-level GVIF.
plot — completed
Run: 20260918T103035-812cf60e5f Dataset: ds-DuSBv8XbgRya7AiXOPKGyjvZfs4a0EKa; version: v-2c412e1a4242d0a0f1a6171f92fcc6531d7982bdefdd723f8b608053e3561131 Request · Result · Run output
Plots
Analysis
- Engine: ggplot2
- X variables: fitted
- Y variables: residual
- Na Action: omit
- Theme: minimal
- Palette: greys
- Width: 9
- Height: 5.5
- Dpi: 160
- Plot Type: scatter
- Output Format: png
- Opacity: 0.7
- Smooth: none
Figures
Figure 1
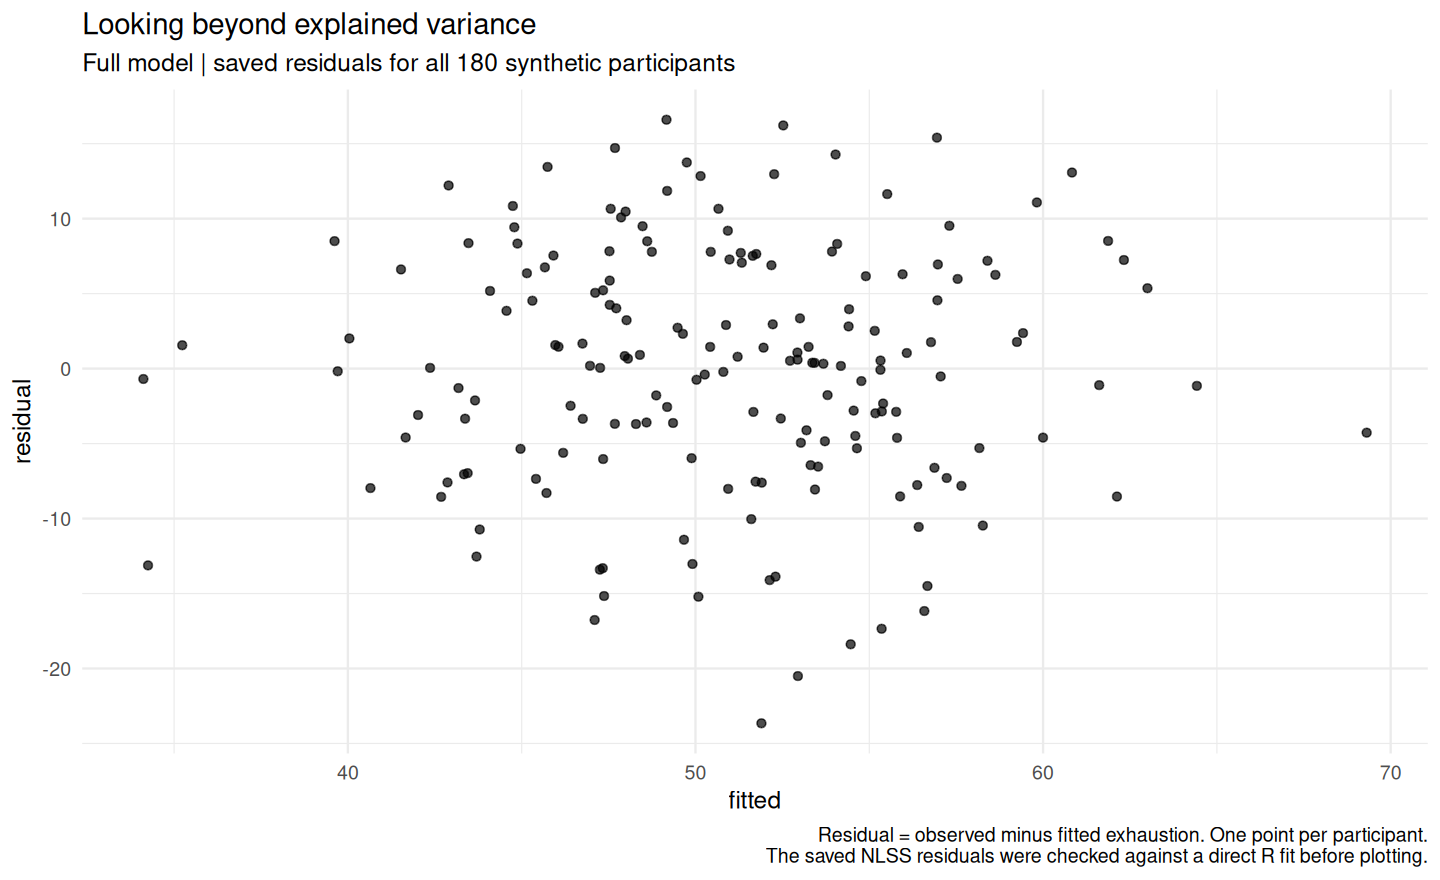
Residual = observed minus fitted exhaustion. One point per participant. The saved NLSS residuals were checked against a direct R fit before plotting.
Note. None.