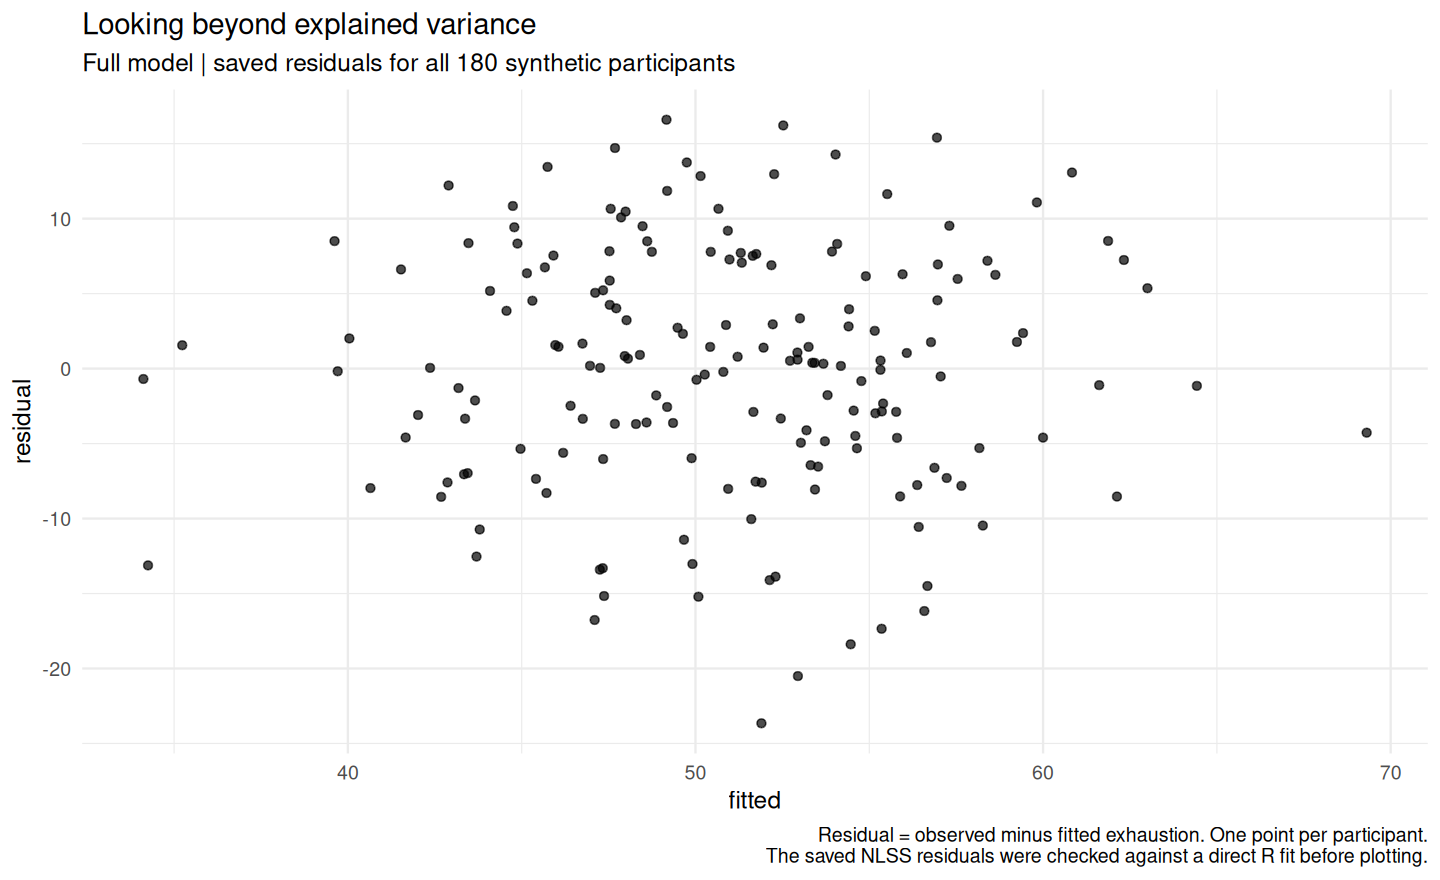
The saved calculation record complements the authored report. It records the numerical work; it does not establish that a method or interpretation is appropriate. Original NLSS figure numbering is preserved.
Plots
Analysis
Engine: ggplot2
X variables: fitted
Y variables: residual
Na Action: omit
Theme: minimal
Palette: greys
Width: 9
Height: 5.5
Dpi: 160
Plot Type: scatter
Output Format: png
Opacity: 0.7
Smooth: none
Figures
Figure 1
Residual = observed minus fitted exhaustion. One point per participant. The saved NLSS residuals were checked against a direct R fit before plotting.