Model comparison · Synthetic study
What do extra predictors add?
Compare two models of exhaustion. Inspect the improvement in fit and question what the predictors really explain.
What do the extra predictors add?
This fictional observational study records age, workload, resources and exhaustion for 180 people on one occasion. We want to know whether workload and resources help explain differences in exhaustion beyond age.
models.csv contains one row per person:
| Column | Meaning |
|---|---|
id |
Participant identifier |
age |
Age in years |
workload |
Workload index; higher means more workload |
resources |
Resources index; higher means more resources |
exhaustion |
Exhaustion index; higher means more exhaustion |
All values are simulated. The three indices are fictional continuous measures, not validated questionnaires; they have no defined scale ranges or clinical cutoffs.
Material 1.0 · Synthetic teaching data · Mike Hammes · CC BY 4.0.
Try it with your agent
Make the analysis your own.
Download the starter ZIP, open its folder in your agent, and send this prompt. Your agent can read the study sheet for you.
Download starter ZIPData, study sheet, prompt and licenses · No answers
Use NLSS to look at models.csv and study-sheet.md. Do workload and resources help explain exhaustion beyond age? Show me what you find and write a short report.Does a better fit make a better explanation?
Consider your answer before opening the reference. The reference is one worked approach; compare the analysis choices before expecting identical numbers.
Compare with the reference analysis
These saved results use the choices described below. Your agent may propose a different approach.
Workload and resources add descriptive information
Adding workload and resources increased explained variance in simulated exhaustion from 4.15% to 33.78%—an increase of 29.62 percentage points. This is a comparison within the same 180 fictional participants. It is not a demonstration of causal effects or out-of-sample predictive performance.
Two planned models, the same people
We fitted ordinary least squares models with age in the first block and age, workload and resources in the second. Predictors retained their original units; there was no automatic variable selection, centering, standardization or bootstrap. There were no missing observations. Nested-model comparison requires the same analysis cases; see the R model-comparison documentation.
| Model | n | R² | Adjusted R² |
|---|---|---|---|
| Age | 180 | .0415 | .0361 |
| Age + workload + resources | 180 | .3378 | .3265 |
The joint incremental test for workload and resources gave F(2, 176) = 39.36, p < .001, with ΔR² = .2962. This tests their combined contribution beyond age, rather than choosing the predictor with the smallest p-value.
| Full-model term | Unstandardized coefficient | 95% CI | p |
|---|---|---|---|
| Intercept | 45.16 | [34.51, 55.80] | < .001 |
| Age, per year | 0.11 | [0.02, 0.20] | .018 |
| Workload, per index point | 0.36 | [0.25, 0.47] | < .001 |
| Resources, per index point | −0.35 | [−0.50, −0.20] | < .001 |
Holding the other included predictors constant, higher workload was associated with higher exhaustion and higher resources with lower exhaustion. The intercept describes an extrapolated zero-predictor combination, not a typical participant. No clinical interpretation follows from the fictional index units.
Look beyond R²
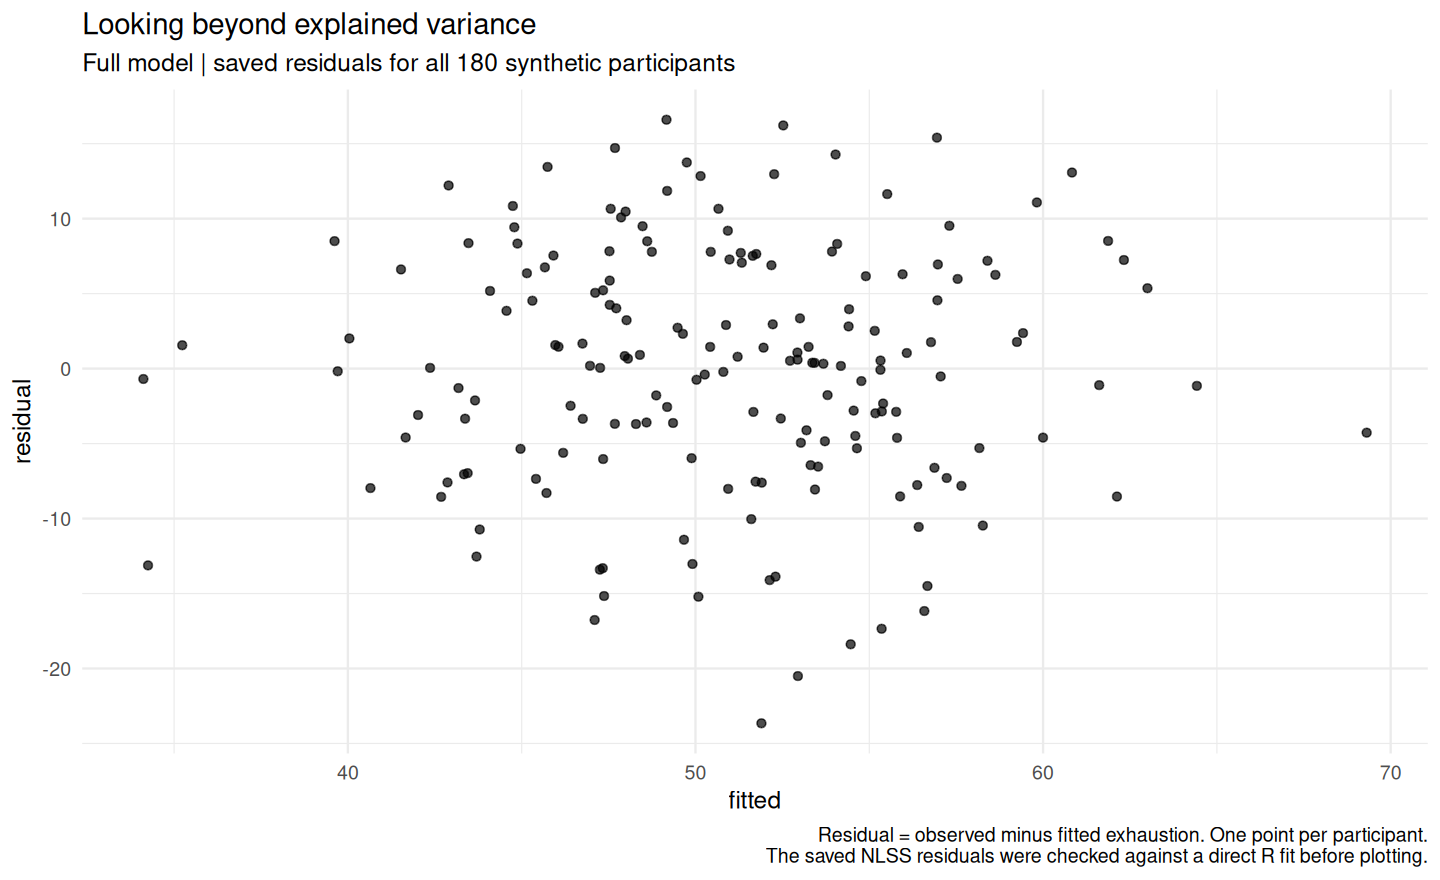
Figure 1. Residuals are observed minus fitted exhaustion. Values were exported from the saved NLSS diagnostic result and checked against a direct R fit before plotting. The plot retains every participant and has no fitted smoother.
The residual plot shows no obvious broad curve or funnel. The full-model Shapiro–Wilk screen gave p = .169 and the studentized Breusch–Pagan screen p = .980; nonsignificant screens do not prove the assumptions. The limited added-quadratic screens also gave no clear indication of curvature. Predictor VIFs ranged from 1.01 to 1.07.
Eleven participants exceeded the exploratory Cook's-distance threshold 4/180, with a maximum of .040. This is a prompt to inspect influential observations, not evidence that eleven records are invalid. None were removed, and no sensitivity refit is claimed. The largest absolute standardized residual was 2.92. These checks do not establish independence, rule out omitted variables or replace substantive model judgment.
The result is an in-sample description under the specified linear model. Cross-sectional associations cannot establish temporal order or causality, and a higher training-sample R² does not guarantee better prediction in new participants.
NLSS 2.0.1 · Material 1.0 · Mike Hammes · CC BY 4.0. See reproduction and evidence.
Follow the result back to R.
Read the calculation record or download the complete reference. Keep it separate from your own study folder.