Saved evidence · NLSS 2.0.1
Analysis protocol
The saved calculation record complements the authored report. It records the numerical work; it does not establish that a method or interpretation is appropriate. Original NLSS figure numbering is preserved.
Analysis protocol
data_explorer — completed
Run: 20260918T102349-182116caff2 Dataset: ds-Qj9FOt1U0ftwqxRqsYgSCsTqrWp9HrrO; version: v-0f6d9a4ba75a028cefba3000031d797836e8efb0b8d755c899c082166dfc55fd Request · Result · Run output
Data Exploration
Analysis
- Variables: id, group, time, outcome
- Max levels: 20
- Top levels: 10
- Rounding digits: 2
Table 1
Variable Overview
| Variable | Class | Scale | n | Missing % | Unique | M | SD | Min | Max |
|---|---|---|---|---|---|---|---|---|---|
| id | integer | interval/ratio | 200 | 0.00 | 100 | 50.50 | 28.94 | 1.00 | 100.00 |
| group | character | nominal | 200 | 0.00 | 2 | ||||
| time | character | nominal | 200 | 0.00 | 2 | ||||
| outcome | numeric | interval/ratio | 200 | 0.00 | 200 | 52.44 | 10.64 | 20.07 | 77.73 |
Note. Scale levels are heuristic; interval/ratio cannot be distinguished automatically.
Table 2
Value Levels
| Variable | Level | n | % | Valid % |
|---|---|---|---|---|
| group | control | 100 | 50.00 | 50.00 |
| group | training | 100 | 50.00 | 50.00 |
| time | post | 100 | 50.00 | 50.00 |
| time | pre | 100 | 50.00 | 50.00 |
Note. % = percent of total. Valid % excludes missing values. Missing values are listed separately.
Narrative
id (integer, scale: interval/ratio): n = 200, missing = 0 (0.00%), unique values = 100. M = 50.50, SD = 28.94, Min = 1.00, Max = 100.00.
group (character, scale: nominal): n = 200, missing = 0 (0.00%), unique values = 2. Levels: control (n = 100, valid % = 50.00); training (n = 100, valid % = 50.00).
time (character, scale: nominal): n = 200, missing = 0 (0.00%), unique values = 2. Levels: post (n = 100, valid % = 50.00); pre (n = 100, valid % = 50.00).
outcome (numeric, scale: interval/ratio): n = 200, missing = 0 (0.00%), unique values = 200. M = 52.44, SD = 10.64, Min = 20.07, Max = 77.73.
mixed_models — completed
Run: 20260918T102559-cc7624fc62 Dataset: ds-Qj9FOt1U0ftwqxRqsYgSCsTqrWp9HrrO; version: v-0f6d9a4ba75a028cefba3000031d797836e8efb0b8d755c899c082166dfc55fd Request · Result · Run output
Mixed Models: Tests of Fixed Effects
Analysis
- Formula: outcome ~ time*group + (1|id)
- Random effects: (1|id)
- REML estimation: Yes
- DF method: satterthwaite
- Sum of squares type: III
- Marginal means: time*group
- Confidence level: 0.95
- Optimizer: bobyqa
- Optimizer maxfun: 100000
- Diagnostics: Yes
- Rounding digits: 2
Table 3
Tests of Fixed Effects
| Effect | Num df | Den df | F | p |
|---|---|---|---|---|
| time | 1.00 | 98.00 | 30.37 | < .001 |
| group | 1.00 | 98.00 | .02 | = .884 |
| time:group | 1.00 | 98.00 | 24.31 | < .001 |
Note. Type III tests of fixed effects. Method: lmerTest F Satterthwaite. Factor coding is preserved in the request; Type III hypotheses must be interpreted with that coding.
Mixed Models: Estimates of Fixed Effects
Analysis
- Formula: outcome ~ time*group + (1|id)
- Random effects: (1|id)
- REML estimation: Yes
- DF method: satterthwaite
- Sum of squares type: III
- Marginal means: time*group
- Confidence level: 0.95
- Optimizer: bobyqa
- Optimizer maxfun: 100000
- Diagnostics: Yes
- Rounding digits: 2
Table 4
Fixed Effects Estimates
| Effect | Estimate | Std. Error | df | t | p | CI lower | CI upper |
|---|---|---|---|---|---|---|---|
| (Intercept) | 52.51 | 1.47 | 124.42 | 35.79 | < .001 | 49.60 | 55.41 |
| timepre | -.42 | 1.02 | 98.00 | -.41 | = .682 | -2.44 | 1.60 |
| grouptraining | 3.84 | 2.07 | 124.42 | 1.85 | = .067 | -.27 | 7.95 |
| timepre:grouptraining | -7.11 | 1.44 | 98.00 | -4.93 | < .001 | -9.97 | -4.25 |
Note. Fixed effects are unstandardized (b) with standard errors. CI uses 95% confidence. df method: satterthwaite. Response: outcome [outcome]. Fit criterion: REML criterion (legacy deviance field). REML criteria must not be used to compare different fixed-effect designs. Degrees-of-freedom method: satterthwaite Confidence level used: 0.95 Random effects: (1|id). Model fit: AIC = 1416.92, BIC = 1436.71, logLik = -702.46. R²m = .06, R²c = .77. ICC = .76.
Narrative
timepre: b = -.42, SE = 1.02, t(98.00) = -.41, p = .682, CI [-2.44, 1.60].
grouptraining: b = 3.84, SE = 2.07, t(124.42) = 1.85, p = .067, CI [-.27, 7.95].
timepre:grouptraining: b = -7.11, SE = 1.44, t(98.00) = -4.93, p < .001, CI [-9.97, -4.25].
Mixed Models: Variance Components
Analysis
- Formula: outcome ~ time*group + (1|id)
- Random effects: (1|id)
- REML estimation: Yes
- DF method: satterthwaite
- Sum of squares type: III
- Marginal means: time*group
- Confidence level: 0.95
- Optimizer: bobyqa
- Optimizer maxfun: 100000
- Diagnostics: Yes
- Rounding digits: 2
Table 5
| Group | Term | Variance | SD | Correlation |
|---|---|---|---|---|
| id | (Intercept) | 81.61 | 9.03 | |
| Residual | Residual | 25.99 | 5.10 |
Narrative
Estimation: REML; 200 observations. Adjusted ICC = .76; unadjusted ICC = .71. R-squared and ICC use performance's model-based variance definitions, including random-slope contributions when present.
Mixed Models: Diagnostics
Analysis
- Formula: outcome ~ time*group + (1|id)
- Random effects: (1|id)
- REML estimation: Yes
- DF method: satterthwaite
- Sum of squares type: III
- Marginal means: time*group
- Confidence level: 0.95
- Optimizer: bobyqa
- Optimizer maxfun: 100000
- Diagnostics: Yes
- Rounding digits: 2
Table 6
| Diagnostic | Status | Statistic | p | Note |
|---|---|---|---|---|
| singular_fit | FALSE | |||
| convergence | ok | |||
| shapiro_wilk | available | .99 | = .040 | Conditional residual normality screen; does not test random-effect normality or independent residuals. |
Narrative
Singularity and optimizer convergence are always reported; residual checks are enabled. Response: outcome [outcome]. Fit criterion: REML criterion (legacy deviance field). REML criteria must not be used to compare different fixed-effect designs. Degrees-of-freedom method: satterthwaite Confidence level used: 0.95
Mixed Models: Marginal Means
Analysis
- Formula: outcome ~ time*group + (1|id)
- Random effects: (1|id)
- REML estimation: Yes
- DF method: satterthwaite
- Sum of squares type: III
- Marginal means: time*group
- Confidence level: 0.95
- Optimizer: bobyqa
- Optimizer maxfun: 100000
- Diagnostics: Yes
- Rounding digits: 2
Table 7
Estimated Marginal Means and Contrasts
| Term | Level | EMM | SE | df | t | p | CI low | CI high | Method |
|---|---|---|---|---|---|---|---|---|---|
| time*group | time=post, group=control | 52.51 | 1.47 | 124.42 | 35.79 | < .001 | 49.60 | 55.41 | emmeans |
| time*group | time=pre, group=control | 52.09 | 1.47 | 124.42 | 35.51 | < .001 | 49.18 | 54.99 | emmeans |
| time*group | time=post, group=training | 56.35 | 1.47 | 124.42 | 38.41 | < .001 | 53.44 | 59.25 | emmeans |
| time*group | time=pre, group=training | 48.82 | 1.47 | 124.42 | 33.28 | < .001 | 45.91 | 51.72 | emmeans |
Note. CI uses 95% confidence.
Narrative
time=post, group=control: estimate = 52.51, SE = 1.47, t(124.42) = 35.79, p < .001, CI [49.60, 55.41].
time=pre, group=control: estimate = 52.09, SE = 1.47, t(124.42) = 35.51, p < .001, CI [49.18, 54.99].
time=post, group=training: estimate = 56.35, SE = 1.47, t(124.42) = 38.41, p < .001, CI [53.44, 59.25].
time=pre, group=training: estimate = 48.82, SE = 1.47, t(124.42) = 33.28, p < .001, CI [45.91, 51.72].
mixed_models — completed
Run: 20260918T102709-4c4502c2 Dataset: ds-Qj9FOt1U0ftwqxRqsYgSCsTqrWp9HrrO; version: v-0f6d9a4ba75a028cefba3000031d797836e8efb0b8d755c899c082166dfc55fd Request · Result · Run output
Mixed Models: Tests of Fixed Effects
Analysis
- Formula: outcome ~ time*group + (1|id)
- Random effects: (1|id)
- REML estimation: Yes
- DF method: satterthwaite
- Sum of squares type: III
- Marginal means: time*group
- Contrasts: custom
- Contrast file: contrast.json
- P-value adjustment: none
- Confidence level: 0.95
- Optimizer: bobyqa
- Optimizer maxfun: 100000
- Diagnostics: Yes
- Rounding digits: 2
Table 8
Tests of Fixed Effects
| Effect | Num df | Den df | F | p |
|---|---|---|---|---|
| time | 1.00 | 98.00 | 30.37 | < .001 |
| group | 1.00 | 98.00 | .02 | = .884 |
| time:group | 1.00 | 98.00 | 24.31 | < .001 |
Note. Type III tests of fixed effects. Method: lmerTest F Satterthwaite. Factor coding is preserved in the request; Type III hypotheses must be interpreted with that coding.
Mixed Models: Estimates of Fixed Effects
Analysis
- Formula: outcome ~ time*group + (1|id)
- Random effects: (1|id)
- REML estimation: Yes
- DF method: satterthwaite
- Sum of squares type: III
- Marginal means: time*group
- Contrasts: custom
- Contrast file: contrast.json
- P-value adjustment: none
- Confidence level: 0.95
- Optimizer: bobyqa
- Optimizer maxfun: 100000
- Diagnostics: Yes
- Rounding digits: 2
Table 9
Fixed Effects Estimates
| Effect | Estimate | Std. Error | df | t | p | CI lower | CI upper |
|---|---|---|---|---|---|---|---|
| (Intercept) | 52.51 | 1.47 | 124.42 | 35.79 | < .001 | 49.60 | 55.41 |
| timepre | -.42 | 1.02 | 98.00 | -.41 | = .682 | -2.44 | 1.60 |
| grouptraining | 3.84 | 2.07 | 124.42 | 1.85 | = .067 | -.27 | 7.95 |
| timepre:grouptraining | -7.11 | 1.44 | 98.00 | -4.93 | < .001 | -9.97 | -4.25 |
Note. Fixed effects are unstandardized (b) with standard errors. CI uses 95% confidence. df method: satterthwaite. Response: outcome [outcome]. Fit criterion: REML criterion (legacy deviance field). REML criteria must not be used to compare different fixed-effect designs. Degrees-of-freedom method: satterthwaite Confidence level used: 0.95 Random effects: (1|id). Model fit: AIC = 1416.92, BIC = 1436.71, logLik = -702.46. R²m = .06, R²c = .77. ICC = .76.
Narrative
timepre: b = -.42, SE = 1.02, t(98.00) = -.41, p = .682, CI [-2.44, 1.60].
grouptraining: b = 3.84, SE = 2.07, t(124.42) = 1.85, p = .067, CI [-.27, 7.95].
timepre:grouptraining: b = -7.11, SE = 1.44, t(98.00) = -4.93, p < .001, CI [-9.97, -4.25].
Mixed Models: Variance Components
Analysis
- Formula: outcome ~ time*group + (1|id)
- Random effects: (1|id)
- REML estimation: Yes
- DF method: satterthwaite
- Sum of squares type: III
- Marginal means: time*group
- Contrasts: custom
- Contrast file: contrast.json
- P-value adjustment: none
- Confidence level: 0.95
- Optimizer: bobyqa
- Optimizer maxfun: 100000
- Diagnostics: Yes
- Rounding digits: 2
Table 10
| Group | Term | Variance | SD | Correlation |
|---|---|---|---|---|
| id | (Intercept) | 81.61 | 9.03 | |
| Residual | Residual | 25.99 | 5.10 |
Narrative
Estimation: REML; 200 observations. Adjusted ICC = .76; unadjusted ICC = .71. R-squared and ICC use performance's model-based variance definitions, including random-slope contributions when present.
Mixed Models: Diagnostics
Analysis
- Formula: outcome ~ time*group + (1|id)
- Random effects: (1|id)
- REML estimation: Yes
- DF method: satterthwaite
- Sum of squares type: III
- Marginal means: time*group
- Contrasts: custom
- Contrast file: contrast.json
- P-value adjustment: none
- Confidence level: 0.95
- Optimizer: bobyqa
- Optimizer maxfun: 100000
- Diagnostics: Yes
- Rounding digits: 2
Table 11
| Diagnostic | Status | Statistic | p | Note |
|---|---|---|---|---|
| singular_fit | FALSE | |||
| convergence | ok | |||
| shapiro_wilk | available | .99 | = .040 | Conditional residual normality screen; does not test random-effect normality or independent residuals. |
Narrative
Singularity and optimizer convergence are always reported; residual checks are enabled. Response: outcome [outcome]. Fit criterion: REML criterion (legacy deviance field). REML criteria must not be used to compare different fixed-effect designs. Degrees-of-freedom method: satterthwaite Confidence level used: 0.95
Mixed Models: Marginal Means
Analysis
- Formula: outcome ~ time*group + (1|id)
- Random effects: (1|id)
- REML estimation: Yes
- DF method: satterthwaite
- Sum of squares type: III
- Marginal means: time*group
- Contrasts: custom
- Contrast file: contrast.json
- P-value adjustment: none
- Confidence level: 0.95
- Optimizer: bobyqa
- Optimizer maxfun: 100000
- Diagnostics: Yes
- Rounding digits: 2
Table 12
Estimated Marginal Means and Contrasts
| Term | Level | Contrast | EMM | Estimate | SE | df | t | p | CI low | CI high | Method |
|---|---|---|---|---|---|---|---|---|---|---|---|
| time*group | time=post, group=control | 52.51 | 1.47 | 124.42 | 35.79 | < .001 | 49.60 | 55.41 | emmeans | ||
| time*group | time=pre, group=control | 52.09 | 1.47 | 124.42 | 35.51 | < .001 | 49.18 | 54.99 | emmeans | ||
| time*group | time=post, group=training | 56.35 | 1.47 | 124.42 | 38.41 | < .001 | 53.44 | 59.25 | emmeans | ||
| time*group | time=pre, group=training | 48.82 | 1.47 | 124.42 | 33.28 | < .001 | 45.91 | 51.72 | emmeans | ||
| time*group | Training_change_minus_control_change | 7.11 | 1.44 | 98.00 | 4.93 | < .001 | 4.25 | 9.97 | custom |
Note. CI uses 95% confidence. Contrasts: custom (contrast.json). File: contrast.json. P-value adjustment: none.
Narrative
time=post, group=control: estimate = 52.51, SE = 1.47, t(124.42) = 35.79, p < .001, CI [49.60, 55.41].
time=pre, group=control: estimate = 52.09, SE = 1.47, t(124.42) = 35.51, p < .001, CI [49.18, 54.99].
time=post, group=training: estimate = 56.35, SE = 1.47, t(124.42) = 38.41, p < .001, CI [53.44, 59.25].
time=pre, group=training: estimate = 48.82, SE = 1.47, t(124.42) = 33.28, p < .001, CI [45.91, 51.72].
Training_change_minus_control_change: estimate = 7.11, SE = 1.44, t(98.00) = 4.93, p < .001, CI [4.25, 9.97].
data_transform — completed
Run: 20260918T102716-d11fcbfc32 Dataset: ds-Qj9FOt1U0ftwqxRqsYgSCsTqrWp9HrrO; version: v-0f6d9a4ba75a028cefba3000031d797836e8efb0b8d755c899c082166dfc55fd Request · Result · Run output
Data Transformations
Analysis
- Recode: time=pre:0,post:1
- Coerce non-numeric: No
- Overwrite Vars: No
Table 13
Transformation Log
| Step | Action | Variable | New Variable | Details |
|---|---|---|---|---|
| 1 | Recoded | time | occasion | pairs=2 |
Note. Actions: Recoded. Steps run in calculation, transformation, standardization, recode, percentile-bin, custom-bin, rename, then drop order. The calculated result is preserved as an immutable version; actual publication status is recorded separately. Replay never changes current working data or its preview.
Narrative
Data transformations were applied in 1 step. Step 1: Recoded time -> occasion (pairs=2).
Step 1: Recoded time -> occasion (pairs=2).
plot — failed
Run: 20260918T102723-1e74f5cedf7 Dataset: ds-Qj9FOt1U0ftwqxRqsYgSCsTqrWp9HrrO; version: v-9426a62c3420b837ffa188fbec0936a13ee926d69b08c05117794a889abc0c6a Request (not included in the reference package) · Result (not included in the reference package)
Error: Plot requires numeric variables: occasion
data_transform — completed
Run: 20260918T102955-4612799b Dataset: ds-Qj9FOt1U0ftwqxRqsYgSCsTqrWp9HrrO; version: v-9426a62c3420b837ffa188fbec0936a13ee926d69b08c05117794a889abc0c6a Request · Result · Run output
Data Transformations
Analysis
- Calc: measurement=1*(time=="post")
- Coerce non-numeric: No
- Overwrite Vars: No
Table 14
Transformation Log
| Step | Action | Variable | New Variable | Details |
|---|---|---|---|---|
| 1 | Calculated | measurement | measurement | 1*(time=="post") |
Note. Actions: Calculated. Steps run in calculation, transformation, standardization, recode, percentile-bin, custom-bin, rename, then drop order. The calculated result is preserved as an immutable version; actual publication status is recorded separately. Replay never changes current working data or its preview.
Narrative
Data transformations were applied in 1 step. Step 1: Calculated measurement (1*(time=="post")).
Step 1: Calculated measurement (1*(time=="post")).
plot — completed
Run: 20260918T103002-11b1d4c62c8 Dataset: ds-Qj9FOt1U0ftwqxRqsYgSCsTqrWp9HrrO; version: v-c89ac616105e09b93b375a0bc69f653adbdf27ced6f3cf758410d050b74da688 Request · Result · Run output
Plots
Analysis
- Engine: ggplot2
- X variables: measurement
- Y variables: outcome
- Grouping variable: group
- Na Action: omit
- Theme: minimal
- Palette: greys
- Width: 9
- Height: 5.5
- Dpi: 160
- Plot Type: line
- Output Format: png
- Opacity: 0.7
- Summary: mean
Figures
Figure 1
Measurement: 0 = pre; 1 = post. Lines connect group means, not individual trajectories. No confidence bands are shown; uncertainty for the change contrast is reported separately.
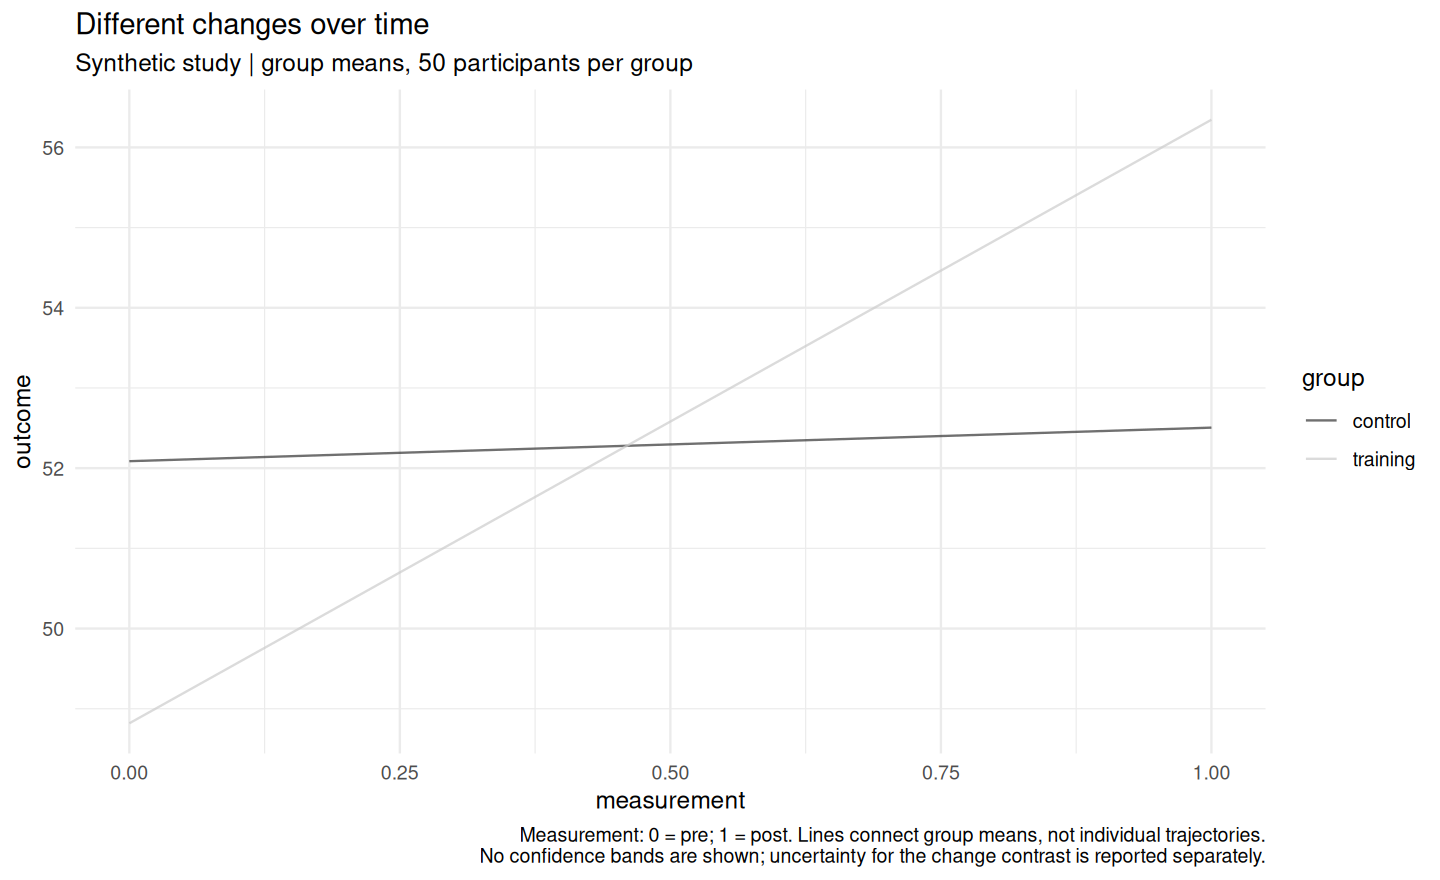
Note. Grouped by group. Line summary: mean; points are connected in x order within each group, not interpreted as individual trajectories.