Change over time · Synthetic study
Did the groups change differently?
Follow the same people from pre to post. Compare changes while keeping their repeated observations linked.
Did the two groups change differently?
In this fictional study, 100 people were randomly assigned to training or control. Functioning was measured before and after the training period for each person. We want to know whether the training group improved more.
intervention.csv contains one row per person and measurement occasion:
| Column | Meaning |
|---|---|
id |
Participant identifier; the same ID links a person's two measurements |
group |
training or control |
time |
pre = before, post = after the training period |
outcome |
Functioning score; higher means better functioning |
All data are simulated. The functioning score is a fictional continuous index with no defined scale range or threshold for a meaningful change.
Material 1.0 · Synthetic teaching data · Mike Hammes · CC BY 4.0.
Try it with your agent
Make the analysis your own.
Download the starter ZIP, open its folder in your agent, and send this prompt. Your agent can read the study sheet for you.
Download starter ZIPData, study sheet, prompt and licenses · No answers
Use NLSS to analyse intervention.csv. The study is described in study-sheet.md. Did the training group improve more than the control group? Show me the change and write a short report.Is a higher final score the same as a larger improvement?
Consider your answer before opening the reference. The reference is one worked approach; compare the analysis choices before expecting identical numbers.
Compare with the reference analysis
These saved results use the choices described below. Your agent may propose a different approach.
The training group changed more—in this simulation
The estimated increase was 7.53 points in training and 0.42 points in control. The planned difference in change was therefore 7.11 points, with a 95% confidence interval of [4.25, 9.97]. These numbers describe a deliberately simulated study, not evidence that a real training intervention works.
Keeping repeated observations together
The dataset contained 100 people, 50 per group, each observed twice. The 200 measurements were analysed with a participant random-intercept model, outcome ~ time * group + (1 | id). Estimation used REML with Satterthwaite degrees of freedom and 95% t-based intervals. All observations were retained. See the NLSS mixed-model reference, lmerTest inference and emmeans model support.
| Group | Occasion | Estimated mean | 95% CI |
|---|---|---|---|
| Control | Pre | 52.09 | [49.18, 54.99] |
| Control | Post | 52.51 | [49.60, 55.41] |
| Training | Pre | 48.82 | [45.91, 51.72] |
| Training | Post | 56.35 | [53.44, 59.25] |
These are model-estimated means; in this balanced, complete design their point estimates equal the observed group-by-time means. Their intervals concern individual means and must not be subtracted to construct the interval for change.
Ask the intended question
We specified exactly one contrast: (training post − training pre) − (control post − control pre). It gave t(98.00) = 4.93, p < .001. No multiplicity adjustment was applied to this single planned contrast, and no additional pairwise contrasts were requested.
The model's reference occasion is post, and its reference group is control. Consequently, the timepre:grouptraining coefficient is −7.11, the opposite sign to the planned change contrast. Named contrast weights preserve the intended direction. This is why an agent should inspect coding before translating a coefficient into a substantive answer.
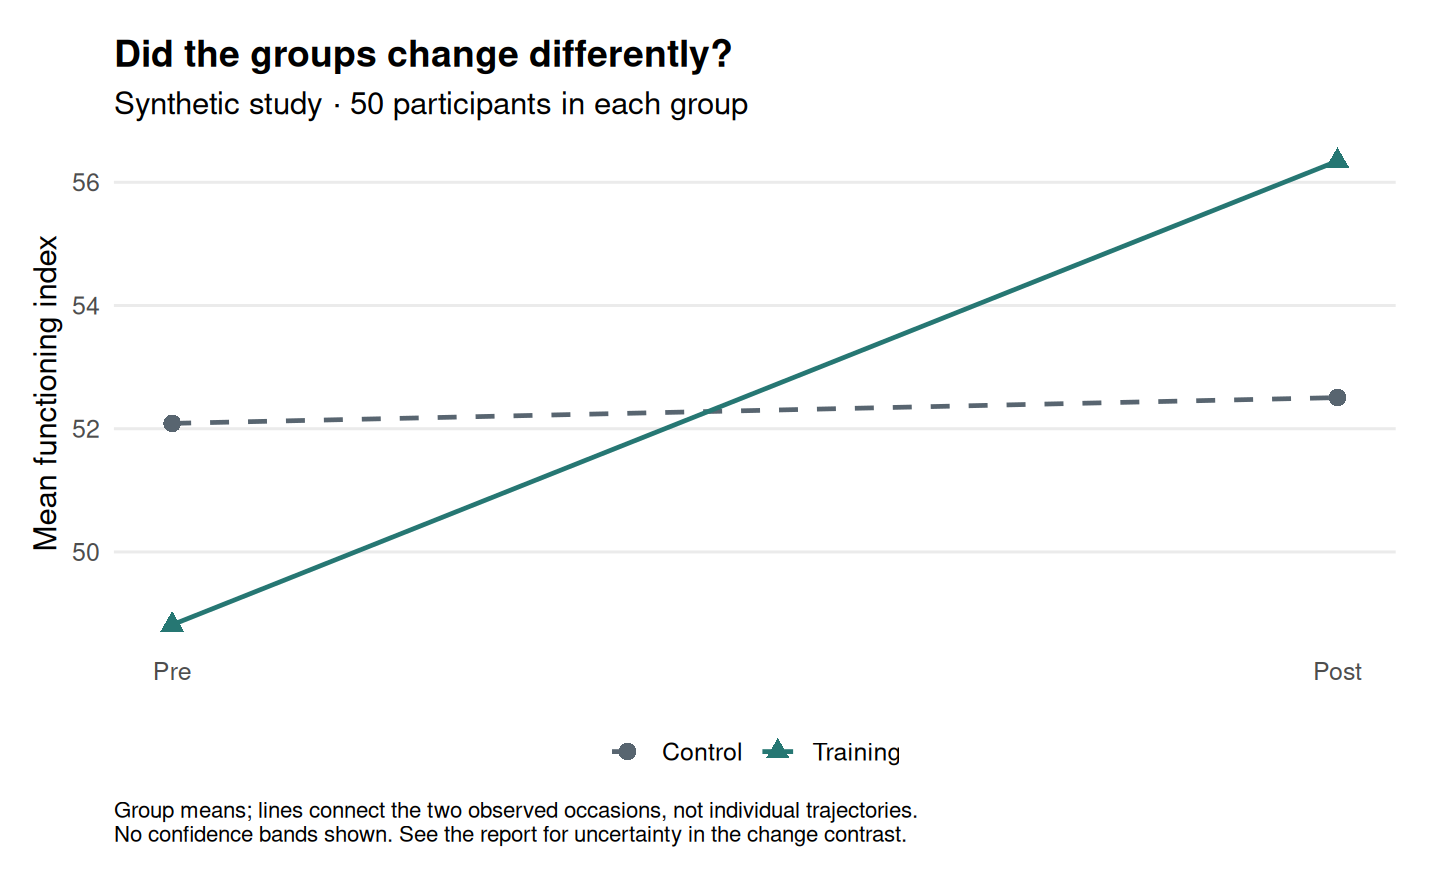
Figure 1. Four observed group means, rendered from NLSS's saved graphical data with explicit occasion labels, stronger contrast and distinct point/line shapes. Lines connect occasions, not individual trajectories. No confidence bands are shown; uncertainty for the change comparison is reported above. The original NLSS figure is retained with the evidence.
What still deserves attention
The fit converged and was not singular. Estimated participant-intercept variance was 81.61 and residual variance was 25.99. A conditional-residual normality screen gave p = .040, so the report does not declare that all assumptions passed. This screen does not assess random-effect normality or independence. The current model also assumes a common residual variance; robustness to a different variance structure has not been demonstrated.
The synthetic training group started lower, despite balanced random assignment. In an actual study, the design, outcome validity, missing follow-up and planned estimand would need scrutiny. A difference in change is the pre-specified target here; it is not automatically interchangeable with a baseline-adjusted post-treatment comparison. No threshold for a practically important change was supplied.
NLSS 2.0.1 · Material 1.0 · Mike Hammes · CC BY 4.0. See reproduction and evidence.
Follow the result back to R.
Read the calculation record or download the complete reference. Keep it separate from your own study folder.