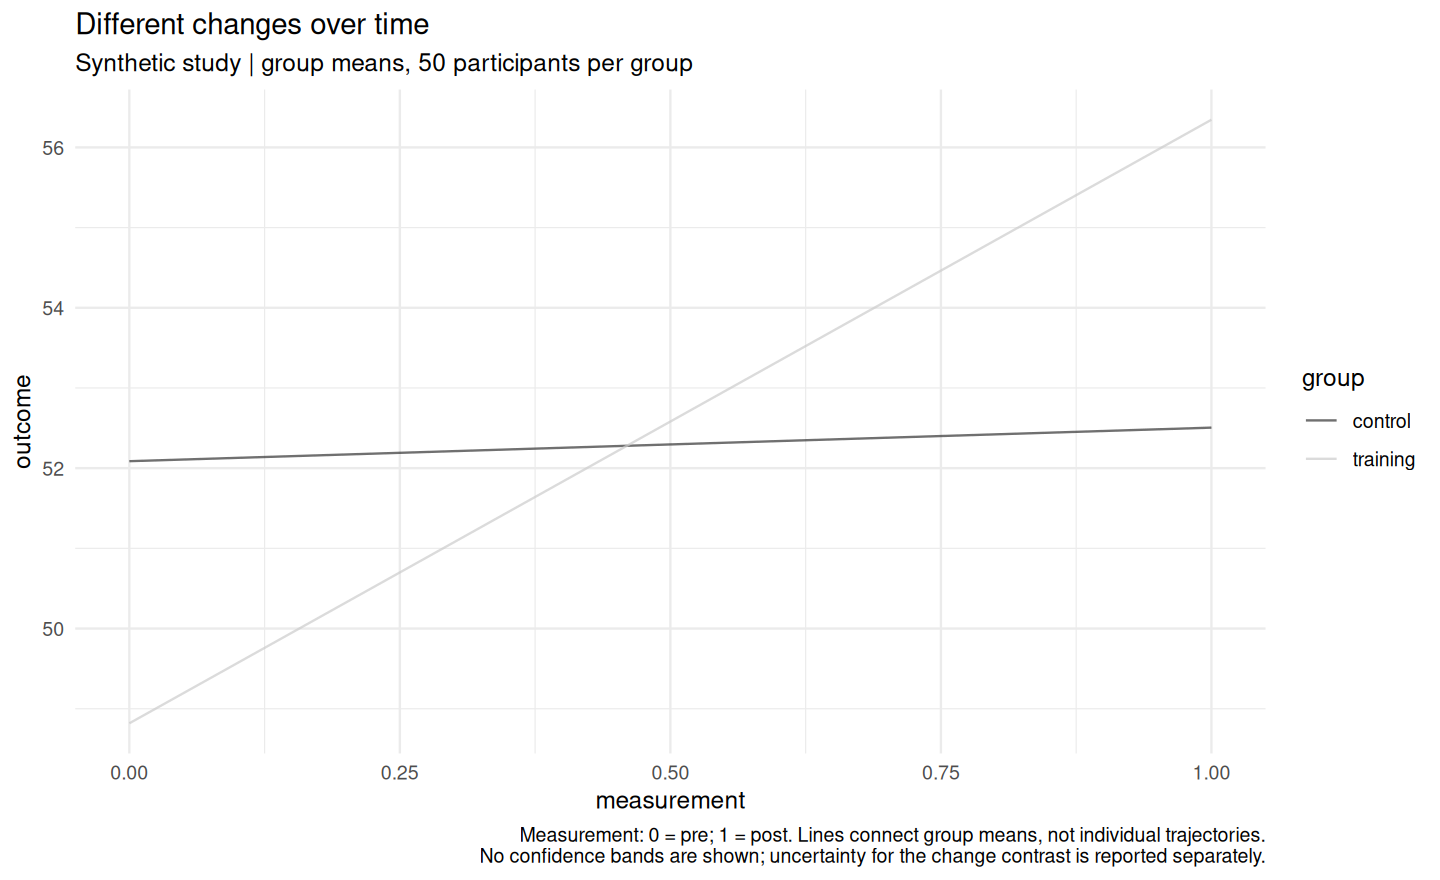
The saved calculation record complements the authored report. It records the numerical work; it does not establish that a method or interpretation is appropriate. Original NLSS figure numbering is preserved.
Plots
Analysis
Engine: ggplot2
X variables: measurement
Y variables: outcome
Grouping variable: group
Na Action: omit
Theme: minimal
Palette: greys
Width: 9
Height: 5.5
Dpi: 160
Plot Type: line
Output Format: png
Opacity: 0.7
Summary: mean
Figures
Figure 1
Measurement: 0 = pre; 1 = post. Lines connect group means, not individual trajectories. No confidence bands are shown; uncertainty for the change contrast is reported separately.