The saved calculation record complements the authored report. It records the numerical work; it does not establish that a method or interpretation is appropriate. Original NLSS figure numbering is preserved.
Plots
Analysis
Engine: ggplot2
Variables: wellbeing
Grouping variable: group
Na Action: omit
Theme: minimal
Palette: greys
Width: 9
Height: 5.5
Dpi: 160
Plot Type: box
Output Format: png
Opacity: 0.7
Figures
Figure 1
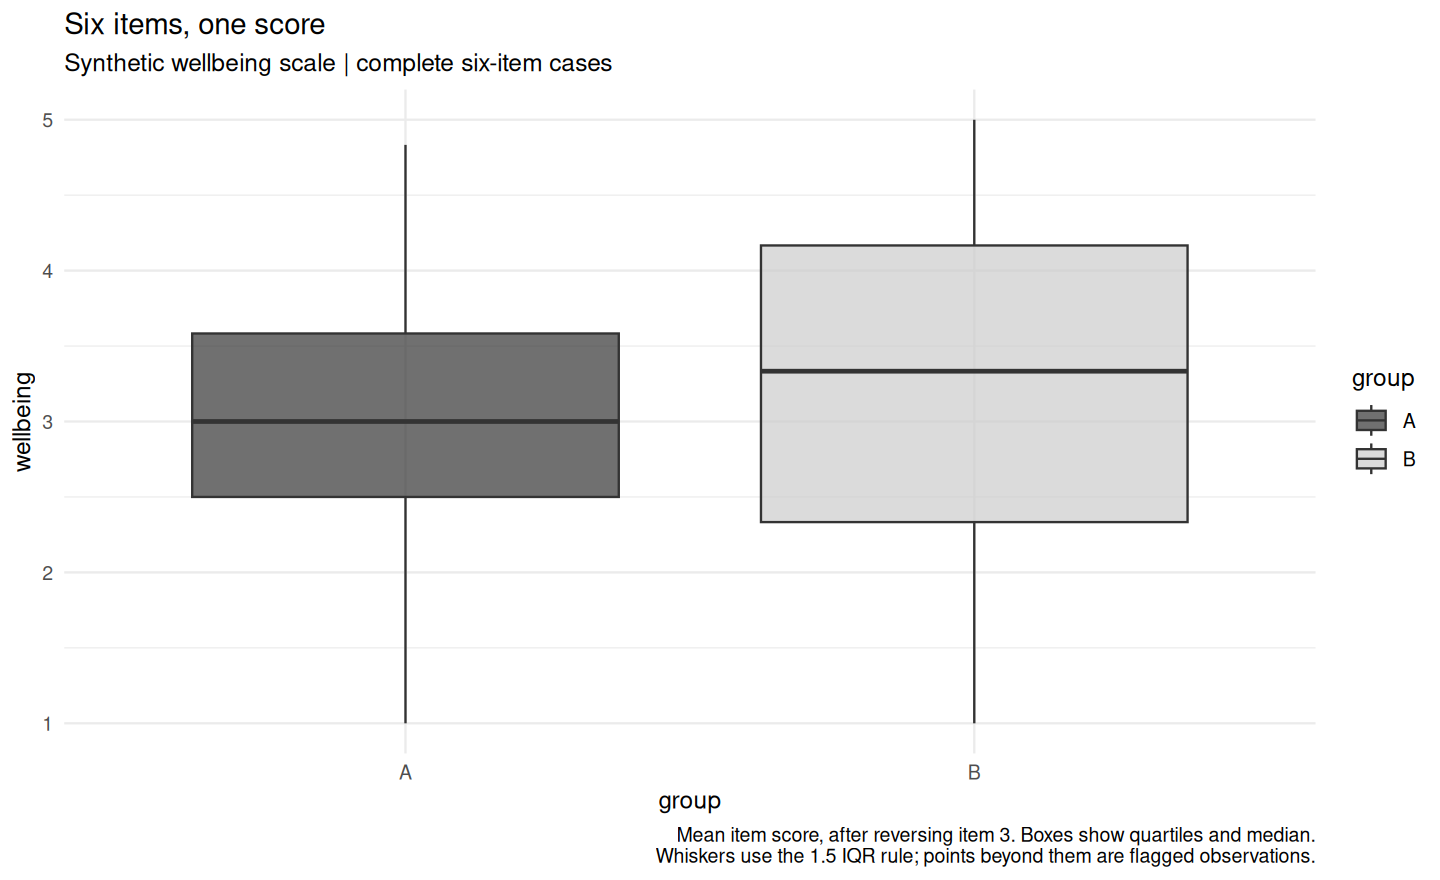
Mean item score, after reversing item 3. Boxes show quartiles and median. Whiskers use the 1.5 IQR rule; points beyond them are flagged observations.