Questionnaire scoring · Synthetic study
Six items, one score
Reverse an item, decide how to handle missing answers, and ask what reliability can—and cannot—tell you.
Can six questions become a useful score?
This fictional study asks 160 people about everyday wellbeing. Each person belongs to group A or B and answers six questions. The group labels have no further meaning in this example. All responses are simulated; these questions are not a validated questionnaire.
scale.csv contains one row per person:
| Column | Meaning |
|---|---|
id |
Participant identifier |
group |
Group A or B |
wb1 |
“I felt cheerful.” |
wb2 |
“I felt calm.” |
wb3 |
“I felt overwhelmed.” |
wb4 |
“I had energy for everyday activities.” |
wb5 |
“I felt connected to others.” |
wb6 |
“I felt able to handle everyday tasks.” |
Answers: 1 = never, 2 = rarely, 3 = sometimes, 4 = often, 5 = always. NA means an unanswered question.
We would like to summarize wellbeing and compare the two groups.
Material 1.0 · Synthetic teaching data · Mike Hammes · CC BY 4.0.
Try it with your agent
Make the analysis your own.
Download the starter ZIP, open its folder in your agent, and send this prompt. Your agent can read the study sheet for you.
Download starter ZIPData, study sheet, prompt and licenses · No answers
Use NLSS to look at scale.csv and study-sheet.md. Can we use these questions as a wellbeing score, and do the groups differ? Show me what you find and write a short report.What changes when one response is missing?
Consider your answer before opening the reference. The reference is one worked approach; compare the analysis choices before expecting identical numbers.
Compare with the reference analysis
These saved results use the choices described below. Your agent may propose a different approach.
A consistent scale, an uncertain group difference
The six fictional wellbeing items showed internal consistency of α = .87 and standardized ω = .87 after reversing the negatively worded item. That is useful information about these responses, but it does not establish that the scale measures wellbeing validly. The group comparison was much less decisive: A − B = −0.17 points, with a 95% confidence interval from −0.48 to 0.14.
From responses to a score
The synthetic dataset contained 160 independent participants. Twelve had one missing answer each; the pre-specified complete-item rule retained 148 people. Item 3 was scored as 6 minus its original response. All six scored items were averaged, on the original 1–5 scale; the raw responses were preserved. No items were removed to raise reliability.
Alpha used the item covariance matrix. Omega used a single-factor maximum-likelihood model of the Pearson correlation matrix, treating the ordinal responses as numeric. It is standardized omega total, not a polychoric ordinal estimate. The six corrected item–rest correlations ranged from .62 to .72. Reliability and the score use the 148 complete cases; individual item means in the automatic protocol use each item's available responses. See the scale method and R factor-analysis documentation.
| Group | Complete scores | Mean | SD |
|---|---|---|---|
| A | 75 | 3.04 | 0.82 |
| B | 73 | 3.21 | 1.05 |
Comparing the groups
The pre-specified two-sided Welch test gave t(135.82) = −1.09, p = .276, with pooled-SD Cohen's d = −0.18 (A minus B). The interval includes differences in both directions. It neither establishes a group difference nor demonstrates equivalence; an equivalence question would need a justified margin and a suitable analysis.
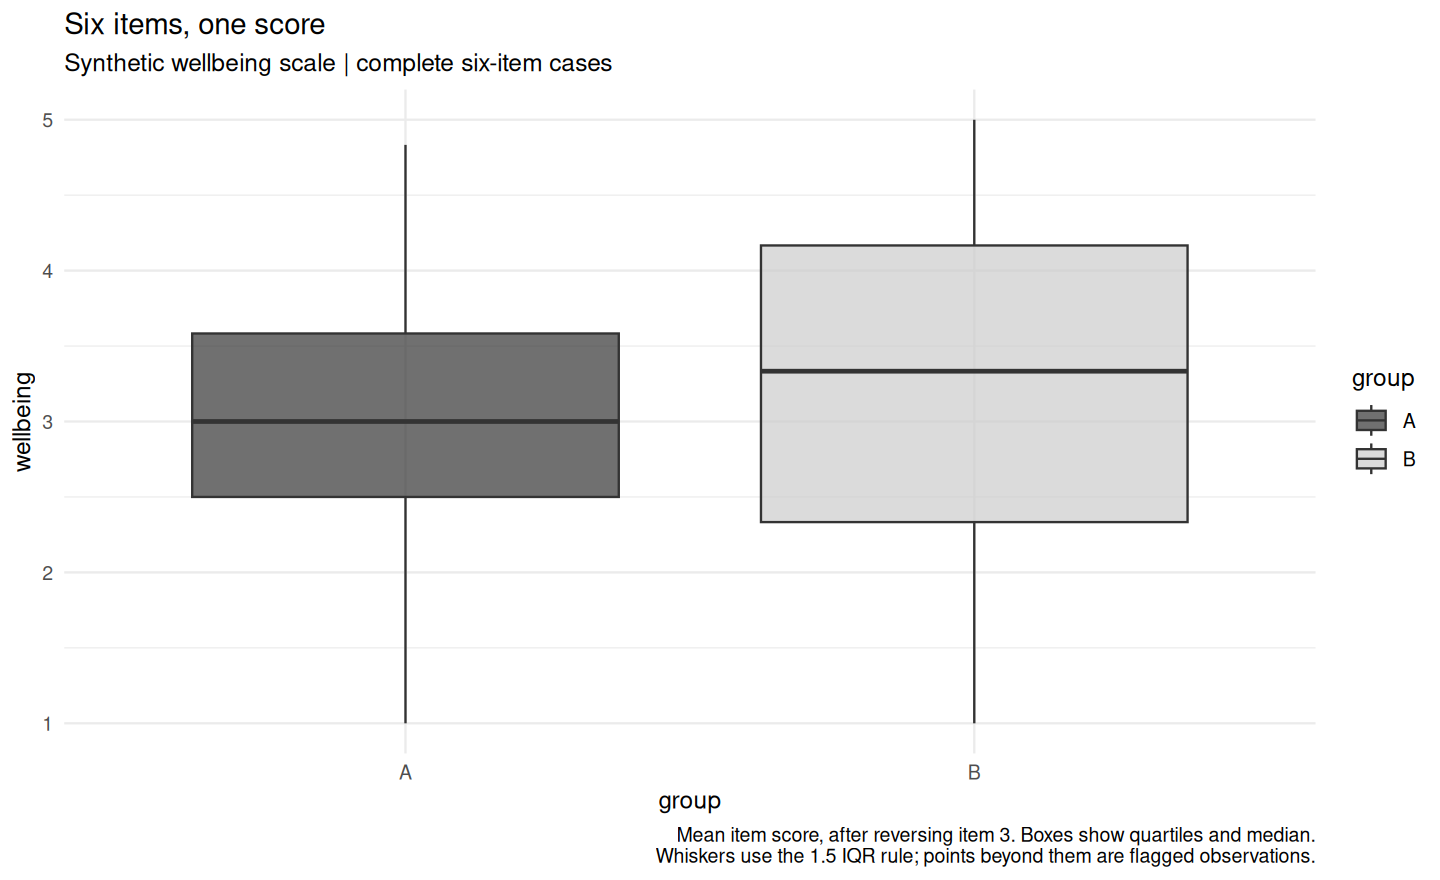
Figure 1. Distributions of complete mean scores. Boxes show the middle half of scores and the median; whiskers use the 1.5 IQR rule. Twelve incomplete scores are excluded. The figure does not show a confidence interval for the mean difference.
The score is bounded and discrete. A Shapiro–Wilk screen flagged group B (p = .011); this is a reason to inspect the distribution, not an automatic instruction to switch tests. Welch's test avoids requiring equal group variances, but does not remove concerns about design, independence or severe distributional problems. Missing responses were assigned independently by the generator; that convenient mechanism must not be assumed for a real questionnaire. Equal measurement meaning across groups has not been established here.
These entirely synthetic data demonstrate a transparent scoring and comparison workflow. They do not validate an instrument or establish a real population difference.
NLSS 2.0.1 · Material 1.0 · Mike Hammes · CC BY 4.0. See reproduction and evidence for the saved runs and independent checks.
Follow the result back to R.
Read the calculation record or download the complete reference. Keep it separate from your own study folder.